Risk Analysis and Root Cause Tools
When developing an effective CAPA plan, resources such as the Fishbone Diagram and 5 Whys tools are often used to determine the exact root cause of the problem. Read the following articles to develop a better understanding of how to build an effective CAPA Plan, use risk assessment matrices to determine risk, and find the root causes of nonconformance using the Fishbone Diagram and 5 Whys templates.
- Building an Effective CAPA Plan: Your 8-Step Guide (i-sight.com)
- How to Use a Risk Assessment Matrix [with Template] (i-sight.com)
- Cause and Effect Analysis: Using Fishbone Diagram and 5 Whys (visual-paradigm.com)
- The Beginner’s Guide to CAPA | Smartsheet
Reflection
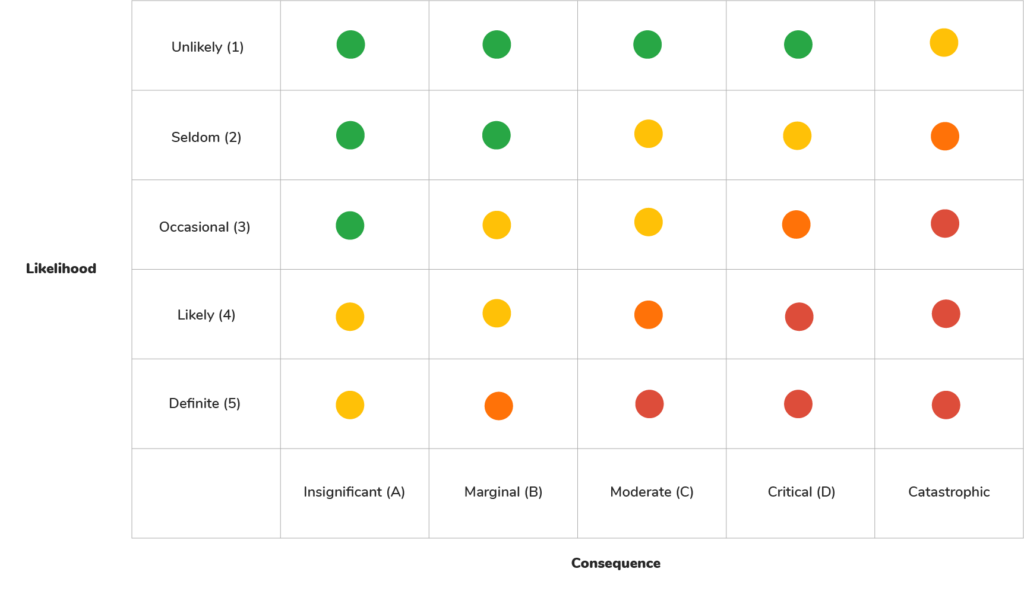
Review the Risk Matrix (Appendix F). Do you think that the company’s response to the low-risk items might be different than the high-risk items? Think about your own place of employment or somewhere you have worked in the past (or might like to work in the future) and what items might be considered low and high risk there. What possible responses might your workplace take for these failed audited items? How to Use a Risk Assessment Matrix [with Template] (i-sight.com)
Risk Matrix
Every risk assessment matrix has two axes; One that measures the consequences impact in the other measure likelihood period to use a risk matrix, extract the data from the risk assessment form and plug it into the matrix accordingly.
- green is low risk
- yellow is medium risk
- orange is high risk
- red is extreme risk

Check Your Understanding
Reflection
Taking into consideration all that you have learned about incidences of nonconformance in relation to quality control, what might be an example of an item that would score high in Product Potential/Component Loss, all Risk criteria, and Detection. Have you ever experienced this in your workplace? What might your company do correct this or prevent this is in the future? We will explore this in more detail in the next section.